Understand Your Aircraft Engine. Track Every Flight.
Free flight analysis, AI engine reports & pilot logbook for Dynon, AFS and MGL pilots.
Select a registration to view its flight data, or upload your own log file.
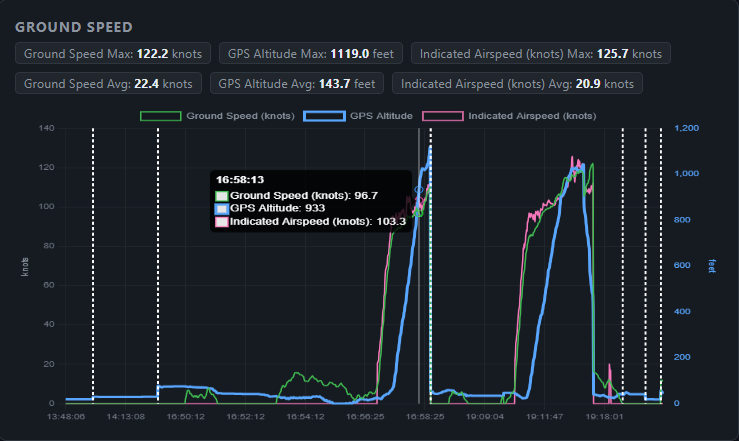
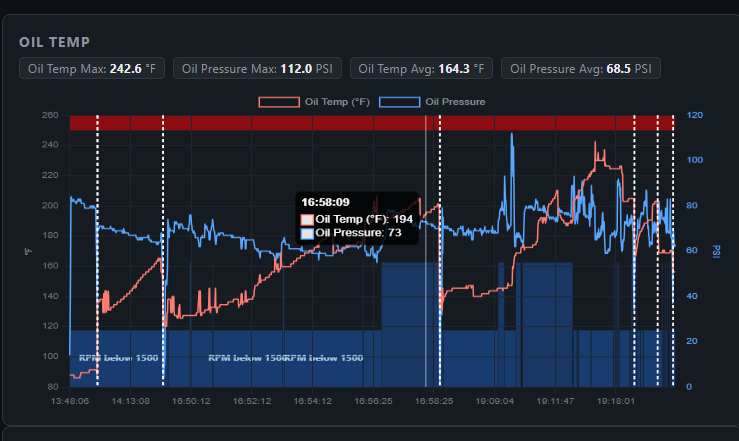
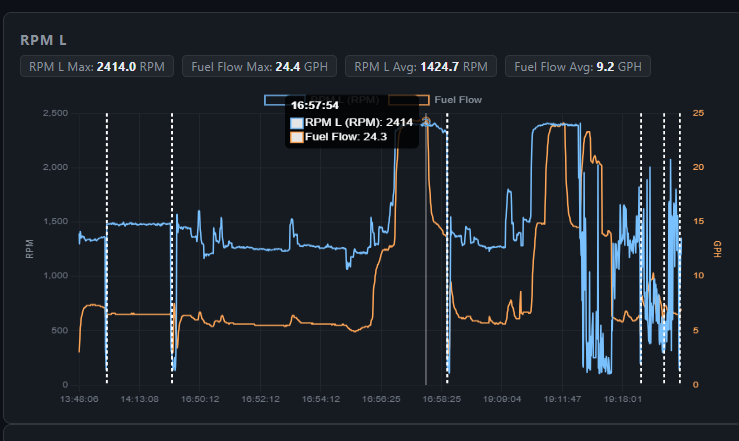
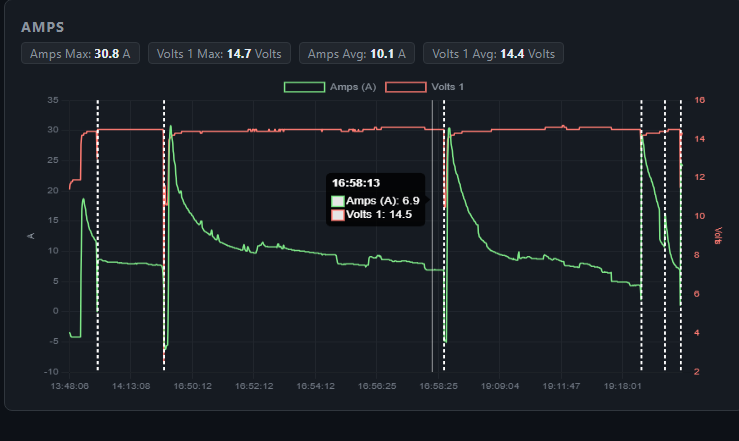
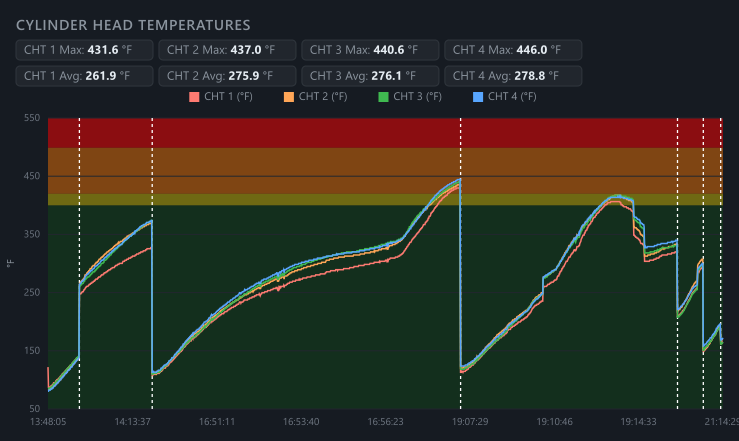
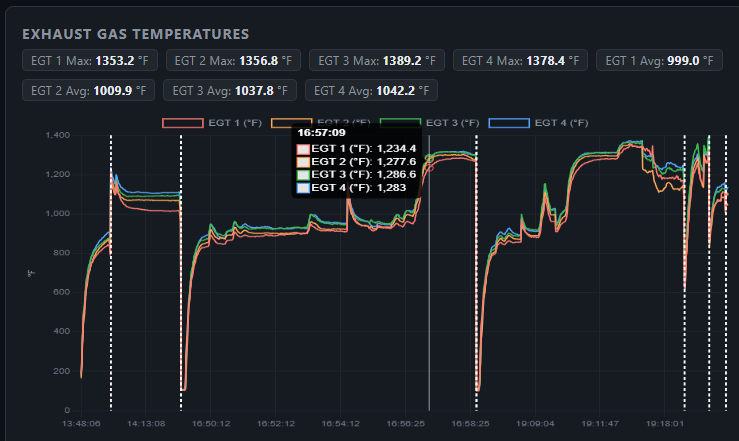
DynonGraph.com is a free, browser-based tool built for owners and builders of experimental, homebuilt, and certified aircraft equipped with Dynon avionics or an Advanced Flight Systems (AFS) EFIS. Simply upload your Dynon USER_LOG_DATA CSV or Advanced Flight Systems ALD export and instantly see your entire flight visualized: RPM, cylinder head and exhaust gas temperatures, oil temperature and pressure, manifold pressure, electrical system performance, airspeed, altitude, vertical speed, fuel flow, and your GPS flight track plotted on a map — even in 3D. Use custom graphs to plot any combination of parameters side by side.
New: DynonGraph now supports Dynon, Advanced Flight Systems (AFS) and MGL EFIS log uploads — drag in your CSV, ALD, or MGL Enigma/Challenger/Explorer/Discovery file — and lets you build and save custom graphs showing exactly the parameters you care about.
DynonGraph also supports pilots worldwide — not just the US N-number format. Registration prefixes from over 200 countries and territories are automatically recognized (Canadian C-, Australian VH-, British G-, and all other ICAO-standard formats), so the country of registration is shown alongside your aircraft title and confirmed when you upload.
DynonGraph also displays LOP (Lean of Peak) and ROP (Rich of Peak) mixture state directly on the EGT chart — teal shading for LOP, amber for ROP, and a dashed line marking peak EGT. For flights where the Dynon lean-assist feature wasn't active, DynonGraph automatically infers lean-to-peak events from EGT and fuel flow patterns. The Flight Summary report now breaks down time spent rich-of-peak, at peak, and lean-of-peak for each flight, alongside full min/max/average stats for oil pressure, voltage, vertical speed, fuel used, and distance flown.
Your exported PDF now leads with that Flight Summary as its own first page, ready for your logbook. When uploading a log, you can also mark your tail number as private so it stays hidden from the public aircraft list — and you can still search directly for a tail number even if it has been marked as Private.
New: DynonGraph now includes advanced engine analysis charts to help you spot problems and track trends: CHT & EGT Spread plots the temperature gap between your hottest and coolest cylinders for both CHT and EGT on one chart — a rising spread can signal a sick cylinder or induction issue. Shock Cooling Rate plots how fast your CHT drops in °F per minute, with a caution line at −50°/min to help you protect your engine during descent. Cylinder Ranking displays peak CHT and peak EGT side by side for every cylinder in a single bar chart, making it easy to see which cylinder is working hardest. Oil Pressure vs RPM is a scatter plot of every oil pressure reading against engine speed, revealing whether your oil system is behaving consistently across the power range.
Three more engine analysis charts dig even deeper: EGT Deviation from Mean plots each cylinder's exhaust temperature relative to the fleet average at every moment, making it easy to pinpoint a cylinder that is persistently running lean or rich compared to its siblings — the classic sign of a stuck injector or failing plug. RPM vs Manifold Pressure Operating Map is a scatter plot of every data point, color-coded from blue to red by cylinder head temperature, showing exactly where in the power envelope your engine spent its time and whether high-power settings drove elevated CHTs. Estimated % Power computes approximate engine power output from RPM, manifold pressure, pressure altitude, and outside air temperature, displayed over time with green, amber, and red bands at 55% and 75% so you can see at a glance how hard the engine was working throughout the flight.
New: DynonGraph now offers AI-powered Engine Analysis — click the Analysis button on any flight to receive an instant engine health report covering cylinder temperatures, mixture efficiency, oil system performance, and personalized maintenance recommendations, all generated by AI. Free users receive 3 analyses per week.
The Summary report now automatically detects takeoffs and landings, estimating the number of landings per flight along with the landing type — Full Stop or Touch & Go. Each departure and landing is looked up against a worldwide airport and seaplane base database, displaying the airport name, ICAO code, city, and elevation. All times are shown in Zulu (UTC). A Pilot Log Book is also available — it compiles all available flights for an aircraft into a single logbook, automatically resolving departure and arrival airports, calculating flight hours, distance, and landings.
New: DynonGraph now includes a Flight Comparison mode — select up to three other flights for the same aircraft and overlay them on a shared set of charts aligned by elapsed time from engine start. Compare altitude profiles, RPM, peak CHT, peak EGT, oil temperature, oil pressure, fuel flow, and indicated airspeed side by side across any flights in your log history, making it easy to spot trends and anomalies over time.
New: DynonGraph now includes a full-screen Flight Instruments replay — a Dynon HDX-style artificial horizon, airspeed and altitude tapes, VSI, and a rotating compass, all driven by your actual flight data. Play back at up to 40x speed or in real time while watching live engine gauges for RPM, oil temperature and pressure, CHT/EGT per cylinder, fuel flow, volts, and amps. Your GPS track is plotted on an FAA VFR sectional chart with an airplane icon that rotates with heading and changes color along an altitude scale as it moves.
DynonGraph automatically detects each individual engine run within your log, flags out-of-range readings like an over-redline tachometer or low oil pressure, and lets you export a clean PDF for your logbook or maintenance records. Create and save custom graphs to compare any parameters that matter most to you. There's nothing to install and no account to create — your data stays private and is only used to generate your own charts.
Whether you're troubleshooting an engine problem, tracking trends over time, or just want a better look at your last flight, DynonGraph turns your raw Dynon log file into clear, actionable graphs in seconds.
DynonGraph works just as well on your phone or tablet as it does on a desktop — every chart and control is touch-friendly, so you can review your flight data right from the hangar or flight line.
Available in English, Spanish, French, Italian, German, Portuguese, Japanese, Mandarin, and Hindi — use the language selector in the top-right corner to switch.
by Don White, creator of: OurChapter.org, EAABuildersLog.org, YEDay.org, FlyingStart.org, GoClub.us, Searey.Us and many more.
See It In Action
Mouseover images to see full graph.